Agribusiness · Fertilisers
Natural Gas and Nitrogen Fertiliser Costs
How Haber-Bosch links gas to ammonia, why gas is most of ammonia's cash cost, US versus European gas costs, and the EBITDA sensitivities CF and Nutrien file.
Selborne Research · Fertilisers coverage: 7 guides, 6 company profiles, a primer and Excel model
Educational analysis for professional use. This guide is not investment advice or a recommendation to buy or sell any security, and it is not personalised.
On this page
Gas Sets the Nitrogen Margin
Gas is the raw material of nitrogen fertiliser as well as its fuel, so a nitrogen producer’s margin moves with the price it pays for gas. The Haber-Bosch process combines nitrogen from the air with hydrogen taken from natural gas to make ammonia. Ammonia is then made into urea, UAN (a solution of urea and ammonium nitrate) and nitrates. Start with the gas price a producer paid, in dollars per MMBtu (million British thermal units, the unit gas is priced in), then apply the sensitivity it files.
The Haber-Bosch Cost Build
At moderate gas prices, gas is most of the cash cost of a tonne of ammonia:
| Component | Illustrative build (Yara Handbook) |
|---|---|
| Gas (36 MMBtu × $7/MMBtu) | $252/t |
| Other cash costs | $39/t |
| Total ammonia cash cost | $291/t |
| Gas share of cash cost | 86.6% |
CF Industries says that for many producers worldwide, gas is more than 70% of the variable cost of making ammonia (Fertilizer Prices FAQ, March 2026). Its own 10-K gives a much lower share for itself: 34% of total production costs in FY2025, and 28% in FY2024. That base includes fixed plant costs and every other input across its sites, and CF’s US gas was cheap. Compare peers on variable or cash cost, not total site cost.
A tonne of urea takes about 0.57 t of ammonia, so about 20 MMBtu of gas. At a Henry Hub price of $3.00/MMBtu, that is $108 per tonne of ammonia or $60 per tonne of urea. A European plant paying $10-13/MMBtu spends $200-260 a tonne of urea on gas alone.
The fictional US producer in the Excel model that comes with the primer adds $35/t of non-gas conversion cost, so gas is 63% of its production cash cost (gas plus conversion), a narrower base than the handbook’s. Add $190/t of other cash costs (fixed costs, overheads, logistics) and its full cash cost is $285/t, against a long-run urea price of $480/t.
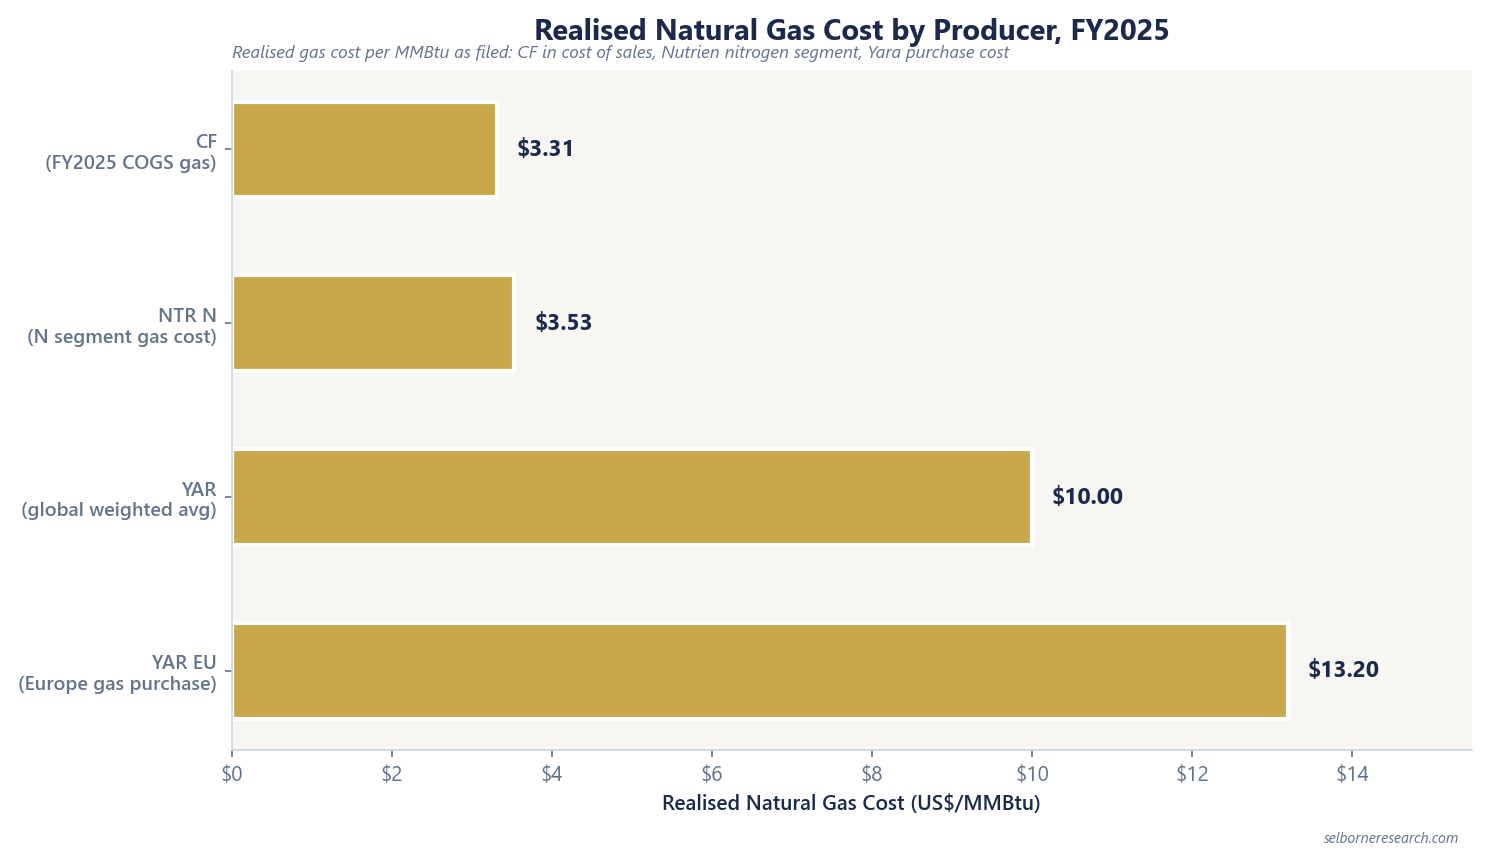
FY2025 Realised Gas Costs
| Producer | FY2025 gas cost | What it covers |
|---|---|---|
| CF Industries | $3.31/MMBtu | Gas in cost of sales, including realised hedges; 352M MMBtu used |
| Nutrien (nitrogen) | $3.53/MMBtu | Nitrogen segment |
| Yara (global) | $10.0/MMBtu | Weighted across its plants, excluding Babrala in India; 226.0M MMBtu, $2,242M |
| Yara (Europe) | $13.2/MMBtu | European plants |
The gap between $3.31-3.53 and $10-13 is most of the nitrogen cost curve. CF Industries sits at the cheap end: Henry Hub averaged $3.53/MMBtu in 2025 on the figure CF cites, and CF’s own cost, including hedges, was lower. Yara International pays European prices at its European plants but can switch. More than 75% of its European finished nitrogen products can be made from imported ammonia instead of its own (4Q25 results presentation, February 2026). That limits the cost of a gas spike without lowering its gas price.
Filed EBITDA Sensitivities
Two filed figures give scenario work its starting point:
| Company | Sensitivity | Base |
|---|---|---|
| Nutrien | ±$180M adjusted EBITDA per $1/MMBtu on NYMEX gas | Consolidated; ±$0.30 adjusted EPS |
| CF Industries | About $800M adjusted EBITDA per $50 per short ton on realised urea | Applied in proportion to its other nitrogen products |
NYMEX gas is the US gas futures contract, settled at Henry Hub. CF’s estimate leaves out the share of earnings owned by CHS, a US farm cooperative with a minority stake in its main US subsidiary, and industrial contracts that already pass price and gas changes to the customer. Both come from the companies’ own models of their plants and hedges, so they are a better starting point than a generic margin percentage.
For Nutrien the gas sensitivity sits inside a business that also sells potash and phosphate. CF makes only nitrogen: it sold 19.06M short tons (2,000 lb each) of product in FY2025 and earned $152 of adjusted EBITDA per short ton.
Long-Run Gas versus Spot
Value on a long-run gas price for the same reason nutrient prices are set at long-run levels. The model’s long-run Henry Hub price is $3.00/MMBtu, one of the long-run prices set out in the mid-cycle earnings guide. It does not fit European plants. The model’s fictional European producer runs on $7.50/MMBtu, a long-run assumption set below Yara’s FY2025 European cost of $13.2/MMBtu.
Ammonia to Finished Nitrogen
Turning ammonia into urea adds labour and energy on top of the feedstock gas, but gas still moves the margin most. To screen a nitrogen producer, start with its realised gas cost, place it on the cost curve, then test it with the filed sensitivities above.
Four hypothetical producers, in US nitrogen, European nitrogen, phosphate and potash, valued year by year as nutrient prices recover to mid-cycle, set beside the through-cycle multiple.
- 15 sections, from how a nutrient producer earns to a year-by-year DCF and leverage on mid-cycle EBITDA
- 43 pages
- a US nitrogen producer on Henry Hub gas, a European nitrogen producer, a phosphate producer and a potash miner
- 4 producer engines
- listed nitrogen, phosphate and potash producers on filed FY2025 figures
- 6-company screen
The Excel model is the primer's mid-cycle valuation live across 13 sheets: four producer tabs (US nitrogen on Henry Hub gas, European nitrogen, phosphate and potash), each walking nutrient prices from the starting point back to mid-cycle through a ten-year free-cash-flow schedule with working capital and sustaining capex; a valuation summary setting each DCF beside the multiple cross-check and splitting the gap between them; cycle scenarios, a cost curve with a gas cost curve, a leverage screen on mid-cycle EBITDA and two live sensitivity grids, urea price against the exit multiple and against the gas price. Change the nutrient price, the gas price or the WACC and the value moves.
See what's in the Fertilisers Sector Primer →£25 PDF · £59 with the Excel model · £159 for all three Agribusiness industries
Frequently Asked Questions
- Why is natural gas the key input for nitrogen fertiliser?
- Gas is both the feedstock and the fuel for the Haber-Bosch process, which makes ammonia, the base of urea, UAN and nitrates. At moderate gas prices it is most of the cash cost of ammonia. CF Industries says gas is more than 70% of the variable cost for many producers worldwide, and the illustrative build in Yara's handbook, at $7/MMBtu, puts gas at 86.6% of a $291/t cash cost ($252 of gas plus $39 of other costs).
- What gas price do US nitrogen producers pay versus Europe?
- In FY2025 CF Industries' gas cost $3.31/MMBtu and Nutrien's nitrogen plants' $3.53/MMBtu. Yara paid a weighted $10.0/MMBtu across its plants and $13.2/MMBtu in Europe, on 226.0M MMBtu ($2,242M in all). The long-run Henry Hub price in the Excel model that comes with the primer is $3.00/MMBtu.
- What EBITDA sensitivities do nitrogen producers disclose?
- Nutrien says each $1/MMBtu move in the NYMEX gas price changes its consolidated adjusted EBITDA by $180M and adjusted EPS by $0.30. CF Industries estimates that a $50 per short ton move in its realised urea price, applied in proportion to its other nitrogen products, changes adjusted EBITDA by about $800M a year. CF's figure leaves out its minority partner's share and industrial contracts that already pass price and gas changes to the customer.
- How much gas does it take to make a tonne of ammonia?
- Yara's Fertilizer Industry Handbook 2025 uses 36 MMBtu per tonne of ammonia as an illustrative industry figure. Plants vary, but 36 is the standard teaching input. At a Henry Hub price of $3.00/MMBtu, the gas in a tonne of ammonia costs $108.
Read next
Fertiliser Cost Curves Explained
How nitrogen, phosphate, and potash cost curves are set by gas access, rock integration, and ore grade, with FY2025 disclosed unit costs from Nutrien, Mosaic, and Intrepid Potash.
Mid-Cycle Earnings for Fertilisers
Why LTM EBITDA fails at price extremes, Nutrien's own $7.0-7.5bn mid-cycle scenario, and how to rebuild normalised EBITDA from long-run nutrient and gas prices.
Nitrogen, Phosphate, Potash Explained
The three crop nutrients, how each is produced, why cost drivers differ by N/P/K, and how Nutrien, CF Industries, and Mosaic illustrate integrated versus specialised models.
Fertiliser EBITDA per Tonne by Nutrient
FY2025 EBITDA per tonne sold for each nutrient business at Nutrien, CF Industries, Mosaic and ICL, why the tonne and the price basis belong on every figure, and how to rebuild it from price and cost.
See it applied
These company profiles apply the concepts from this guide to real public companies.