Financials · Insurance
Insurer Expense Ratio Benchmarks: FY2025 Ranked
FY2025 expense ratios for ten US P&C insurers ranked, from Kinsale at 20.8% to Markel at 36.1%, with loss ratios and each filer's basis beside the figure.
Selborne Research · Insurance coverage: 9 guides, 6 company profiles, a primer and Excel model
Educational analysis. This guide is not investment advice or a recommendation to buy or sell any security, and it is not personalised.
On this page
Expense Ratios Spread Wider Than Loss Ratios in FY2025
In FY2025 the expense ratios of ten large US property-and-casualty insurers ran from 20.8% to 36.1%. Their loss ratios ran from 55.1% to 65.9%, a narrower range. Most of that width is Markel’s insurance segment at 36.1%; the other nine ran from 20.8% to 31.1%.
The expense ratio is underwriting expenses, mainly commissions, premium taxes and administration, divided by premium. The loss ratio is claims and claim-handling costs over the same premium. The two add up to the combined ratio. The loss ratio vs expense ratio guide explains why the split matters.
FY2025 Expense Ratios, Ranked
Every figure is the company’s own FY2025 ratio from its year-end results or annual report, filed in January and February 2026. All ten divide by earned premium, the part of premium covering the period already elapsed, rather than premium newly written.
| Rank | Company | Scope | Expense ratio | Loss ratio | Combined ratio |
|---|---|---|---|---|---|
| 1 | Kinsale (KNSL) | Consolidated | 20.8% | 55.1% | 75.9% |
| 2 | Allstate (ALL) | Property-Liability | 21.4% | 63.8% | 85.2% |
| 3 | Progressive (PGR) | Companywide underwriting | 21.5% | 65.9% | 87.4% |
| 4 | Chubb (CB) | P&C | 26.6% | 59.1% | 85.7% |
| 5 | W. R. Berkley (WRB) | Consolidated | 28.3% | 62.4% | 90.7% |
| 6 | Travelers (TRV) | Consolidated | 28.5% | 61.4% | 89.9% |
| 7 | Cincinnati Financial (CINF) | Consolidated P&C | 29.3% | 65.6% | 94.9% |
| 8 | Hartford (HIG) | Property & Casualty | 30.2% | 59.9% | 90.3% |
| 9 | AIG | General Insurance | 31.1% | 59.0% | 90.1% |
| 10 | Markel (MKL) | Markel Insurance segment | 36.1% | 58.4% | 94.6% |
Hartford’s combined ratio also includes a 0.2-point policyholder dividend ratio. Markel’s two halves do not add exactly to its reported 94.6% because of rounding.
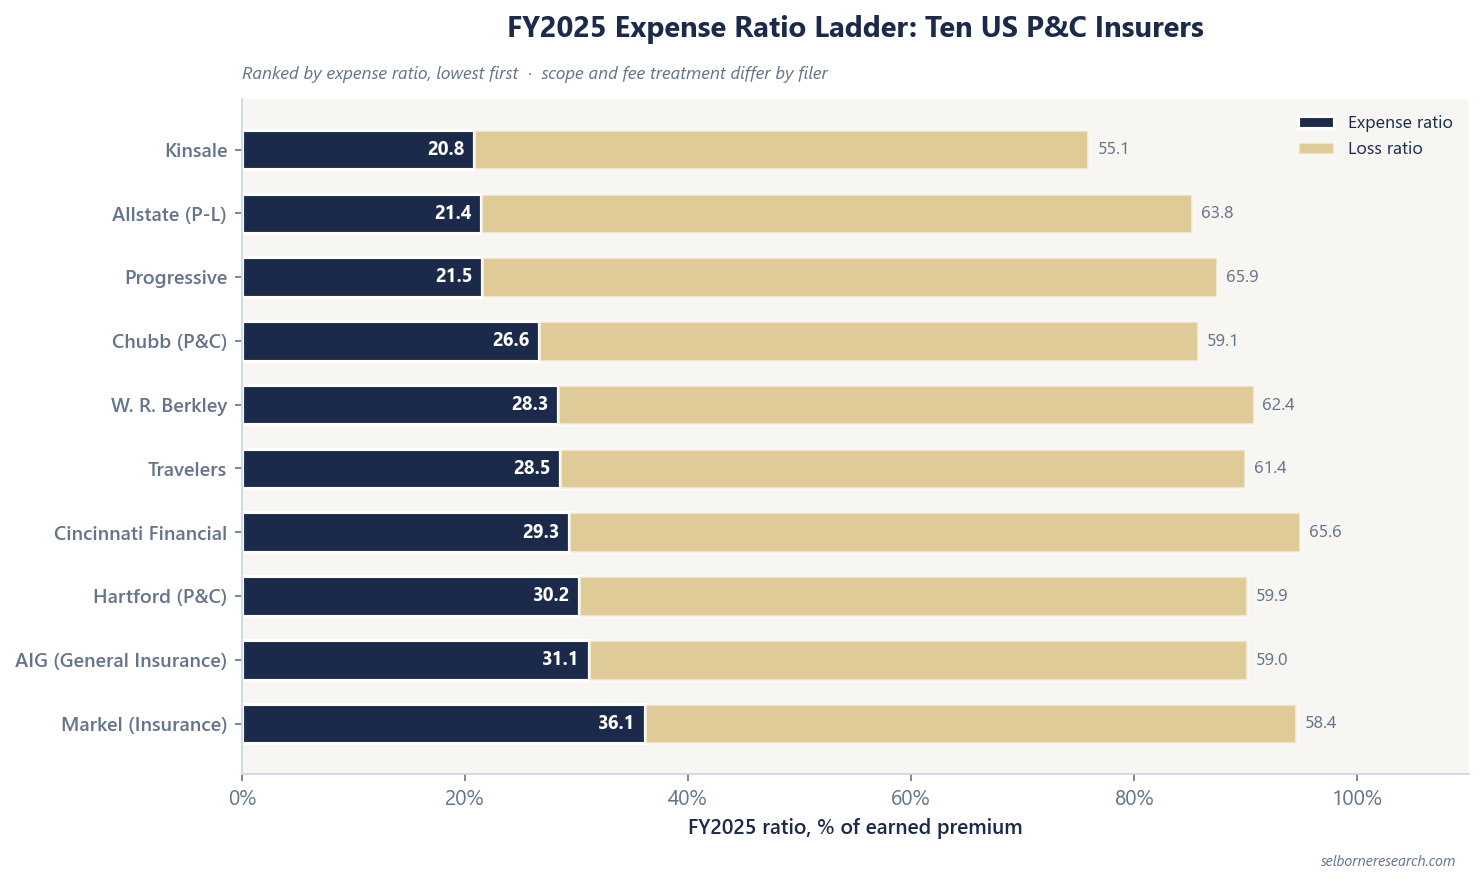
Three companies sit near 21%, six between 26.6% and 31.1%, and Markel’s insurance segment alone at 36.1%.
Low Expense and Low Loss Rarely Come Together
Two of the three lowest expense ratios belong to companies with some of the highest loss ratios: Progressive at 65.9% and Allstate at 63.8%. The three highest expense ratios, at Markel, AIG and Hartford, come with loss ratios between 58.4% and 59.9%. The two halves partly offset.
Kinsale is the exception. It has the lowest ratio on both halves in this set, and its 75.9% combined ratio compares with 85.2% at Allstate, the next lowest.
AIG splits its expense ratio in two: an acquisition ratio of 18.1% and a general operating expense ratio of 13.0%. Acquisition costs, mainly commissions, are the larger part.
Selling direct is not automatically cheaper. In Progressive’s personal vehicle business, the agency channel ran a 20.1% underwriting expense ratio in FY2025 and the direct channel 22.1%. The agency book pays agent commissions; the direct book pays for the advertising that brings in its quotes.
Smaller Basis Differences
Earned premium is the common denominator here, which removes the largest trap: an expense ratio on written premium comes out lower whenever an insurer is growing, because written premium runs ahead of earned.
- Fee income netted against expenses. Progressive deducts certain fees and other revenues from underwriting expenses. Travelers nets fee income. Allstate deducts other revenue. Each lowers the reported expense ratio.
- Fee income added to the denominator. Kinsale divides by net earned premium plus fee income: $1,575.8m plus $40.7m in FY2025. The larger denominator lowers both of its ratios.
- Costs left out. Hartford leaves the integration costs of its 2019 Navigators acquisition out of its expense ratio, and reports policyholder dividends as a separate ratio.
- One-off items left in. Progressive’s FY2025 expense ratio includes 1.5 points of policyholder credit expense in Florida.
- Scope. AIG, Allstate, Hartford and Markel report a segment. Chubb reports its P&C business, which excludes its life insurance operations. A segment ratio can leave out closed books still paying old claims, and corporate costs that the group carries.
- Labels. Chubb calls its ratio the policy acquisition cost and administrative expense ratio. Cincinnati Financial calls it the underwriting expense ratio. They measure the same thing.
The Expense Ratio Is the Stable Half
Allstate’s FY2025 loss ratio includes 8.6 points of catastrophe losses, and Progressive’s 1.8. One storm season can add or remove catastrophe losses on that scale.
The expense ratio has no catastrophe line. It moves with commission rates, staff costs and how fast premium grows. That makes it the better guide to an insurer’s structure, and the harder half to change. A company that wants to cut five points from its expense ratio usually has to change how it sells insurance.
Placing a New Name on the Ladder
Before adding a company to this table, check four things in its own filings.
- The denominator. Earned or written premium, and whether fee income is in it.
- The numerator. Which fees are netted, and which costs are excluded.
- The scope. The whole group, the P&C business or one segment.
- The year. A FY2024 figure next to FY2025 ones mixes two pricing years.
If any answer differs from the table, note it beside the figure. A gap of one point between two insurers can come entirely from how each one defines the ratio.
The expense ratio is the slow-moving half of the combined ratio. The primer carries the combined ratio through a ten-year underwriting build.
- 16 sections, P&C and life in one primer
- 42 pages
- two P&C archetypes plus a life spread book
- 3 worked valuations
- combined ratio, ROE, yield basis
- 6-company screen
The Excel model is the primer's three residual-income valuations live across 13 sheets: change the combined ratio, the spread or the cost of equity and the justified P/BV moves.
See what's in the Insurance Sector Primer →£25 PDF · £59 with the Excel model · £159 for all three Financials industries
Frequently Asked Questions
- What is a typical expense ratio for a P&C insurer?
- Across ten large US property-and-casualty insurers in FY2025, the expense ratio ran from 20.8% at Kinsale to 36.1% in Markel's insurance segment. Six of the ten sat between 26% and 32%. Each figure is the company's own, struck on earned premium, but scope and fee treatment differ, so read a gap of a point or less as noise.
- Which insurer had the lowest expense ratio in FY2025?
- Kinsale, at 20.8%, followed by Allstate's Property-Liability business at 21.4% and Progressive at 21.5%. Kinsale divides by net earned premium plus fee income, which lowers its ratios a little. Allstate and Progressive net revenue against expenses, which lowers theirs.
- Do insurers with low expense ratios also have low combined ratios?
- Mostly, in FY2025: the three lowest expense ratios came with combined ratios of 75.9%, 85.2% and 87.4%. But Allstate and Progressive gave part of that back through loss ratios of 63.8% and 65.9%, while the three highest expense ratios came with loss ratios of 58.4% to 59.9%. The two halves partly offset.
- Are expense ratios on written or earned premium?
- All ten companies here state their FY2025 expense ratio on earned premium in their own filings. That removes the main trap but not the smaller ones: Travelers, Progressive and Allstate net certain fee or other revenue against expenses, Kinsale adds fee income to the denominator, and Hartford excludes Navigators integration costs.
Read next
Loss Ratio, Expense Ratio, Combined Ratio
Same total, different halves, different businesses; plus the earned-versus-written denominator mismatch.
Combined Ratio Benchmarks 2026
Four-band ladder plus the structural drivers of each rung: line mix, catastrophe load, expense discipline, reserving posture.
Accident Year vs Calendar Year Combined Ratio
Two correct answers for one period; the gap between the bases is the development. Ex-cat is the third variant.
See it applied
These company profiles apply the concepts from this guide to real public companies.
Also in Insurance
- Combined Ratio: the P&C Scoreboard
- P/BV vs ROE for Insurers
- Float and the Investment-Income Engine
- Reserve Development: Favourable vs Adverse
- The Life Insurance Spread Business
- Combined Ratio Benchmarks 2026: Progressive to AIG
- Loss Ratio, Expense Ratio, Combined Ratio: Which Matters
- Insurer Expense Ratio Benchmarks: FY2025 Ranked
- Accident Year vs Calendar Year Combined Ratio